Lessons from running an YBIYRI team


Agenda
- DevOps Benefits
- Our Journey
- Lessons
- Current Status
- Conclusion
Why DevOps?
Why DevOps
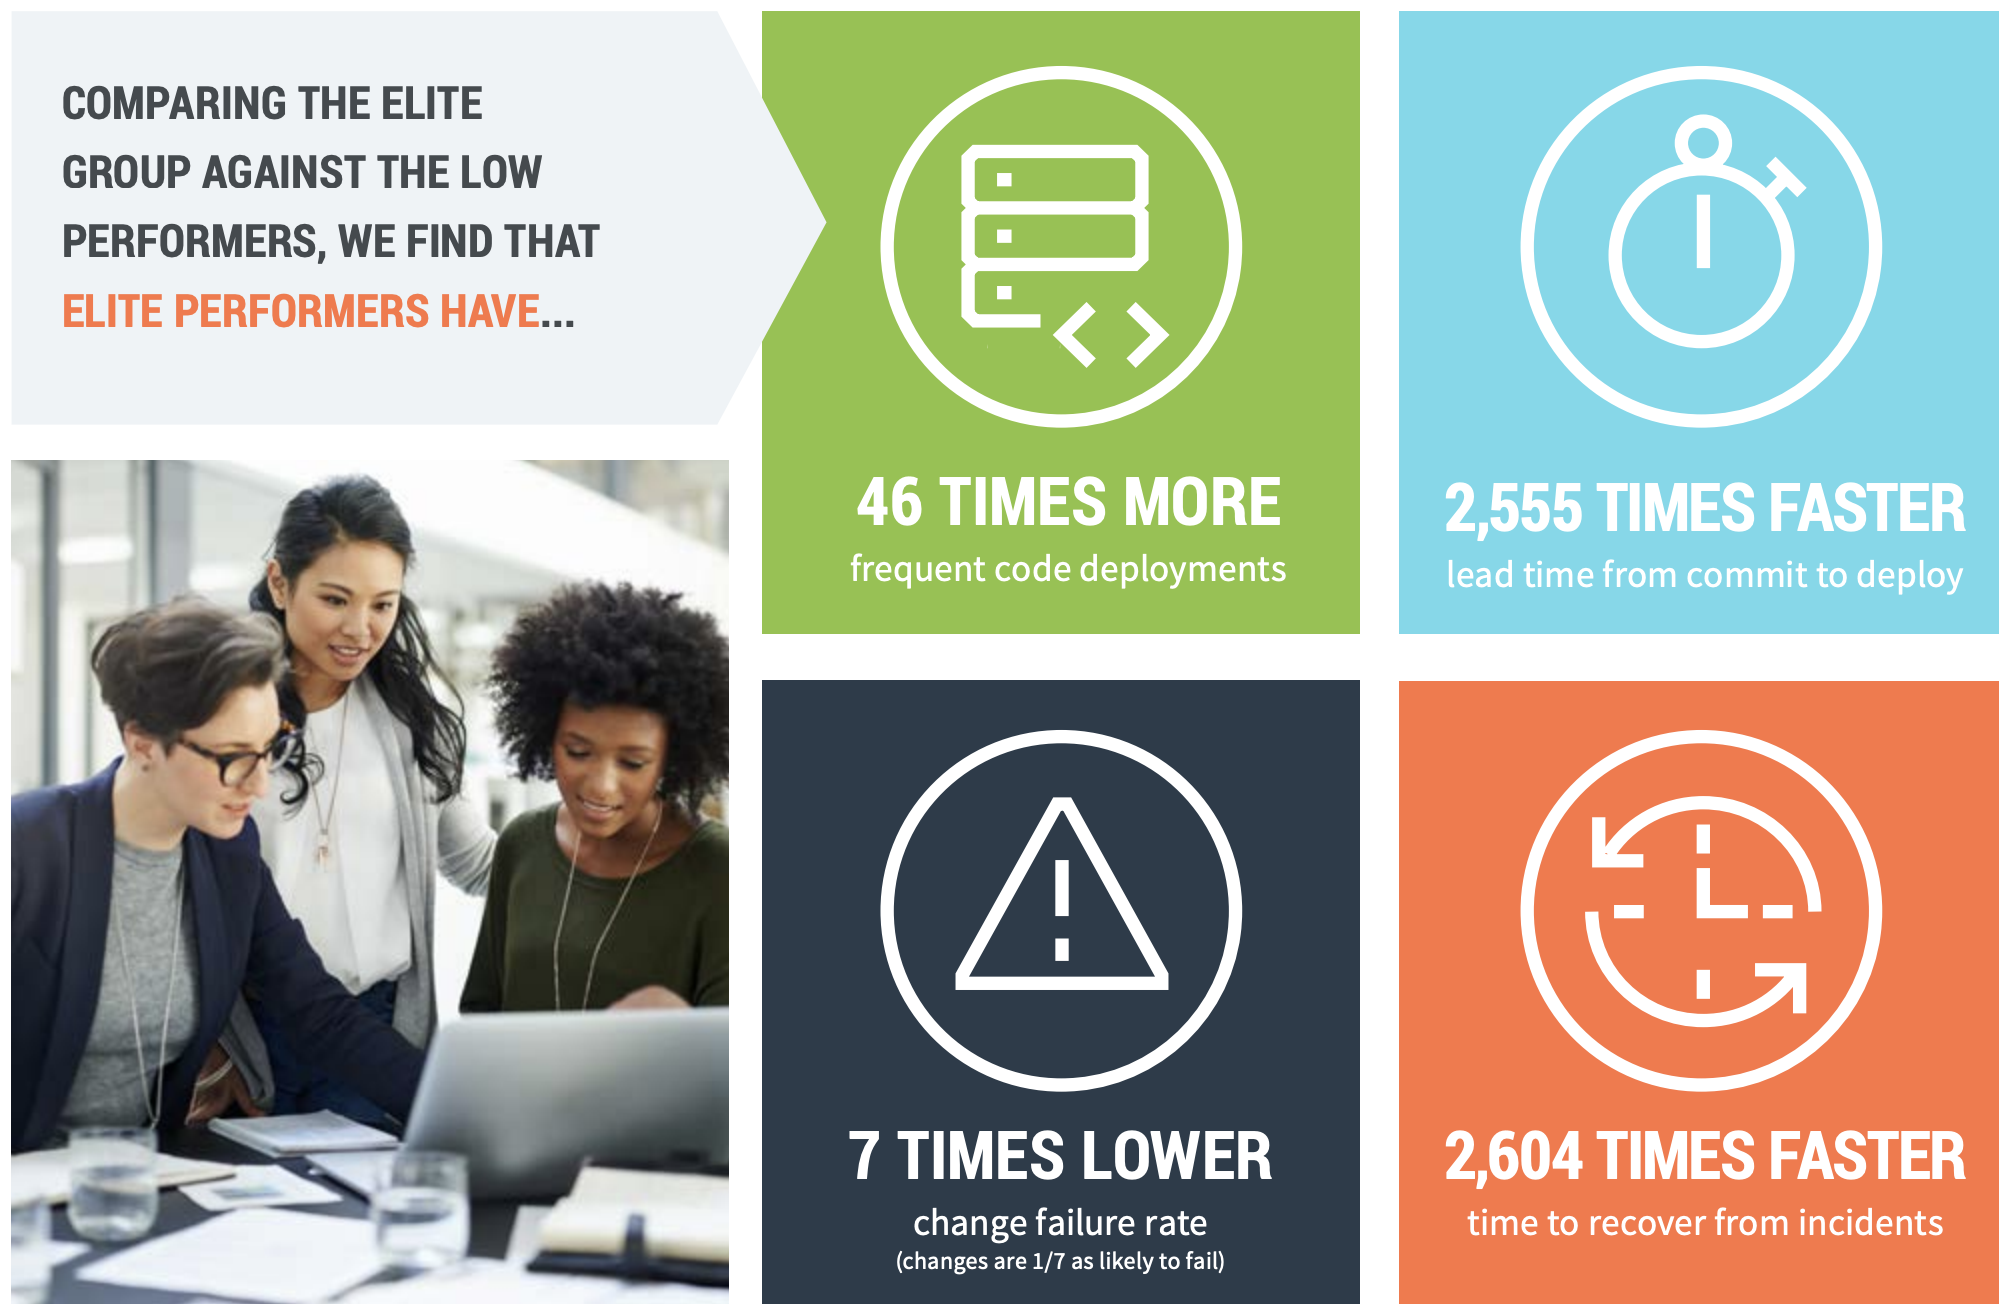
Software Delivery Performance
Those that develop and deliver quickly are better able to experiment with ways to increase customer adoption and satisfaction, pivot when necessary, and keep up with compliance and regulatory demands.
Software Delivery and Operational Performance
Why DevOps
Organisational Performance
Software Delivery and Operational Performance (SDO)
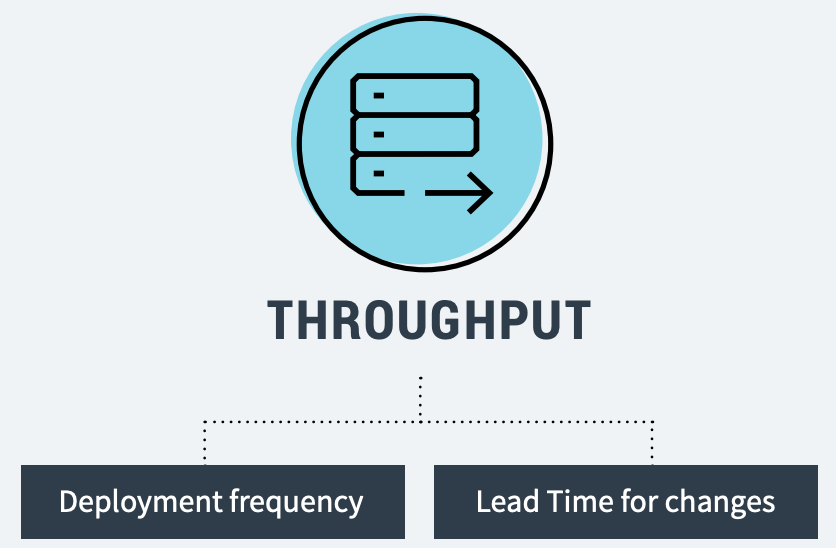
Software Delivery Performance
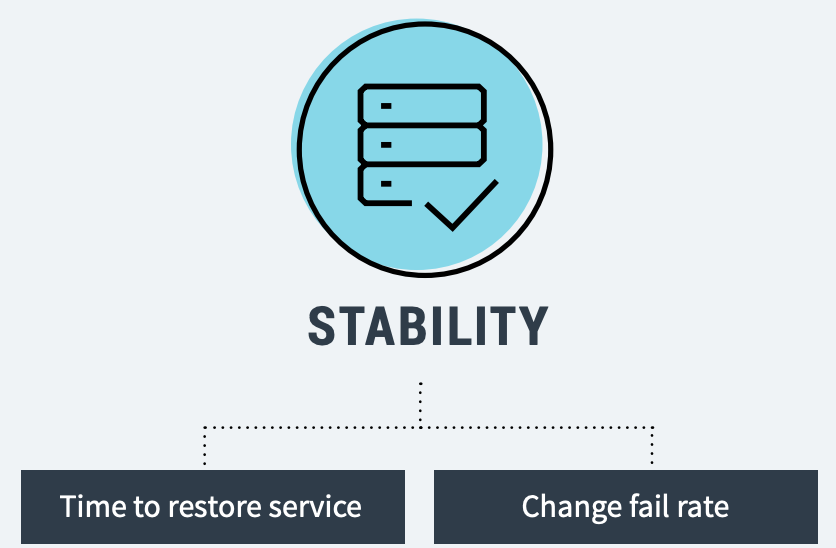
Service Operational Performance
Software Delivery Performance
- Cycle Time (from commit to production)
- Failure Rate

Service Operational Performance
- Availability
- Time to Restore

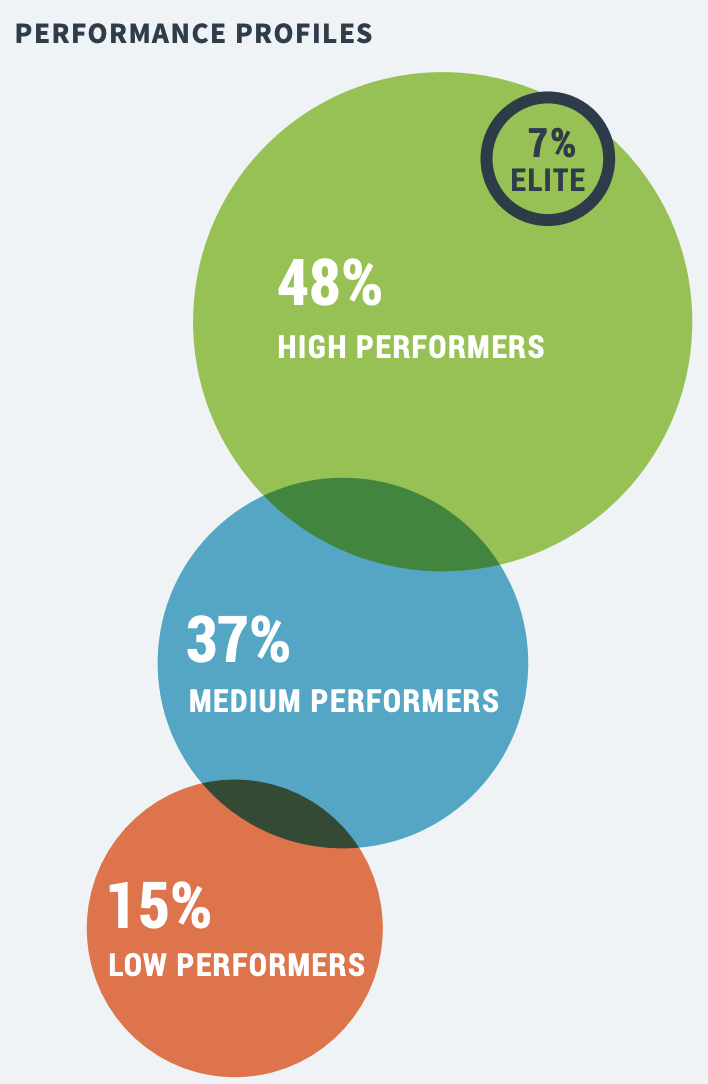
Performance Distribution
Our Journey
- First team to adopt cloud (2017)
- First team to adopt the "You Build It, You Run It" principle
- Responsible to provide data for reporting
- Learned by doing, and now sharing...
Operational Models
Normal Scrum/XP setup was not enough
- Should we just add a Ops person to the team?
- Are we responsible for every little thing?
- Compliance? Regulations? Pipelines?
Operational Models
- Amazon "you build it, you run it"
- Google SRE
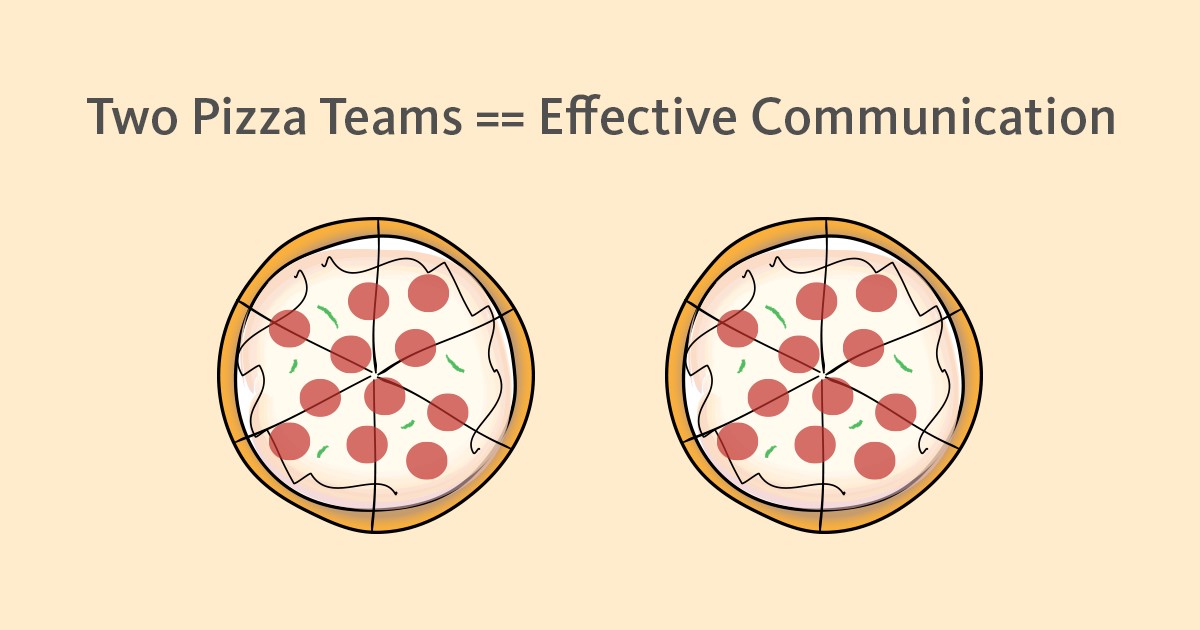
Amazon You build it, you run it
- Two pizzas team
- Operational responsibility inside the team
- Customer contact
Google SRE
- Site Reliability Engineers
- Close collaboration with Delivery Teams
- Veto power on production environments
Tyro Way
Delivery Teams
- Service Owners
- You Build It, You Run It principle
Platform Teams
- Build the rails
- Facilitate Compliance, Security, Regulatory Work...
New area of knowledge
We are developers, we know how to do it...
New area of knowledge
Defining Service Levels
SLI - Service Level Indicators
A carefully defined quantitative measure of some aspect of the level of service that is provided
-
Ex:
- Response Time
- Data Durability
- Up Time
- Availability
SLO - Service Level Objectives
A target value or range of values for a service level that is measured by an SLI
-
Examples:
- Availability: 99.95%
-
Response Time:
- 95 percentile: <= 500ms
- 99 percentile: < 1000ms
- Data Durability: 5 years
| Availability level | Allowed unavailability window | |||||
|---|---|---|---|---|---|---|
| per year | per quarter | per month | per week | per day | per hour | |
| 90% | 36.5 days | 9 days | 3 days | 16.8 hours | 2.4 hours | 6 minutes |
| 95% | 18.25 days | 4.5 days | 1.5 days | 8.4 hours | 1.2 hours | 3 minutes |
| 99% | 3.65 days | 21.6 hours | 7.2 hours | 1.68 hours | 14.4 minutes | 36 seconds |
| 99.5% | 1.83 days | 10.8 hours | 3.6 hours | 50.4 minutes | 7.20 minutes | 18 seconds |
| 99.9% | 8.76 hours | 2.16 hours | 43.2 minutes | 10.1 minutes | 1.44 minutes | 3.6 seconds |
| 99.95% | 4.38 hours | 1.08 hours | 21.6 minutes | 5.04 minutes | 43.2 seconds | 1.8 seconds |
| 99.99% | 52.6 minutes | 12.96 minutes | 4.32 minutes | 60.5 seconds | 8.64 seconds | 0.36 seconds |
| 99.999% | 5.26 minutes | 1.30 minutes | 25.9 seconds | 6.05 seconds | 0.87 seconds | 0.04 seconds |
Security
Defense in depth
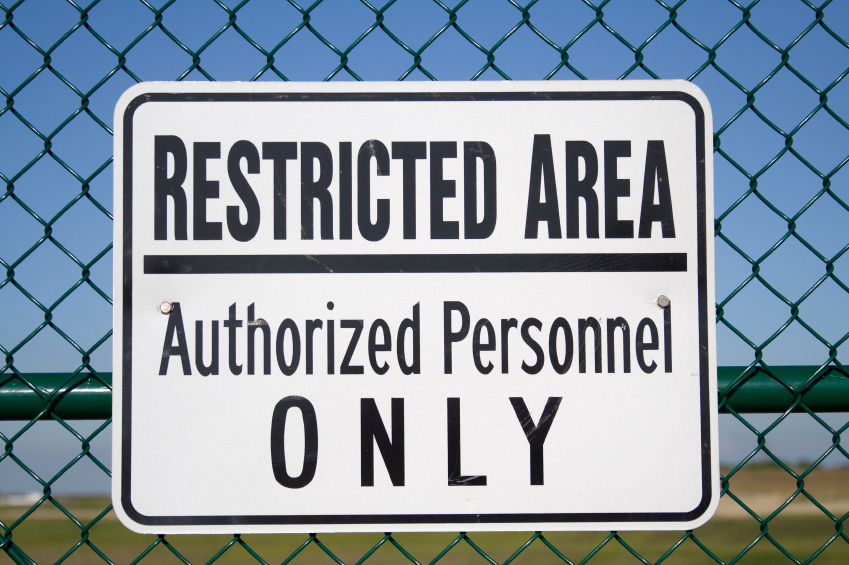
Least Privilege
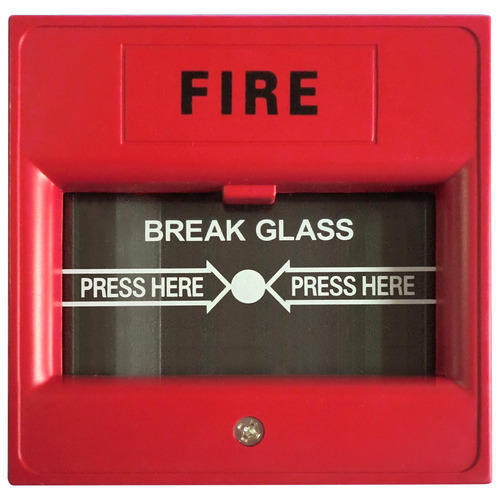
Break Glass
Monitoring
Monitoring
Closed Box
Open Box
- How the user sees your service
-
Knows the internals of the application
- Logs
- JVM
- Health Check Pages
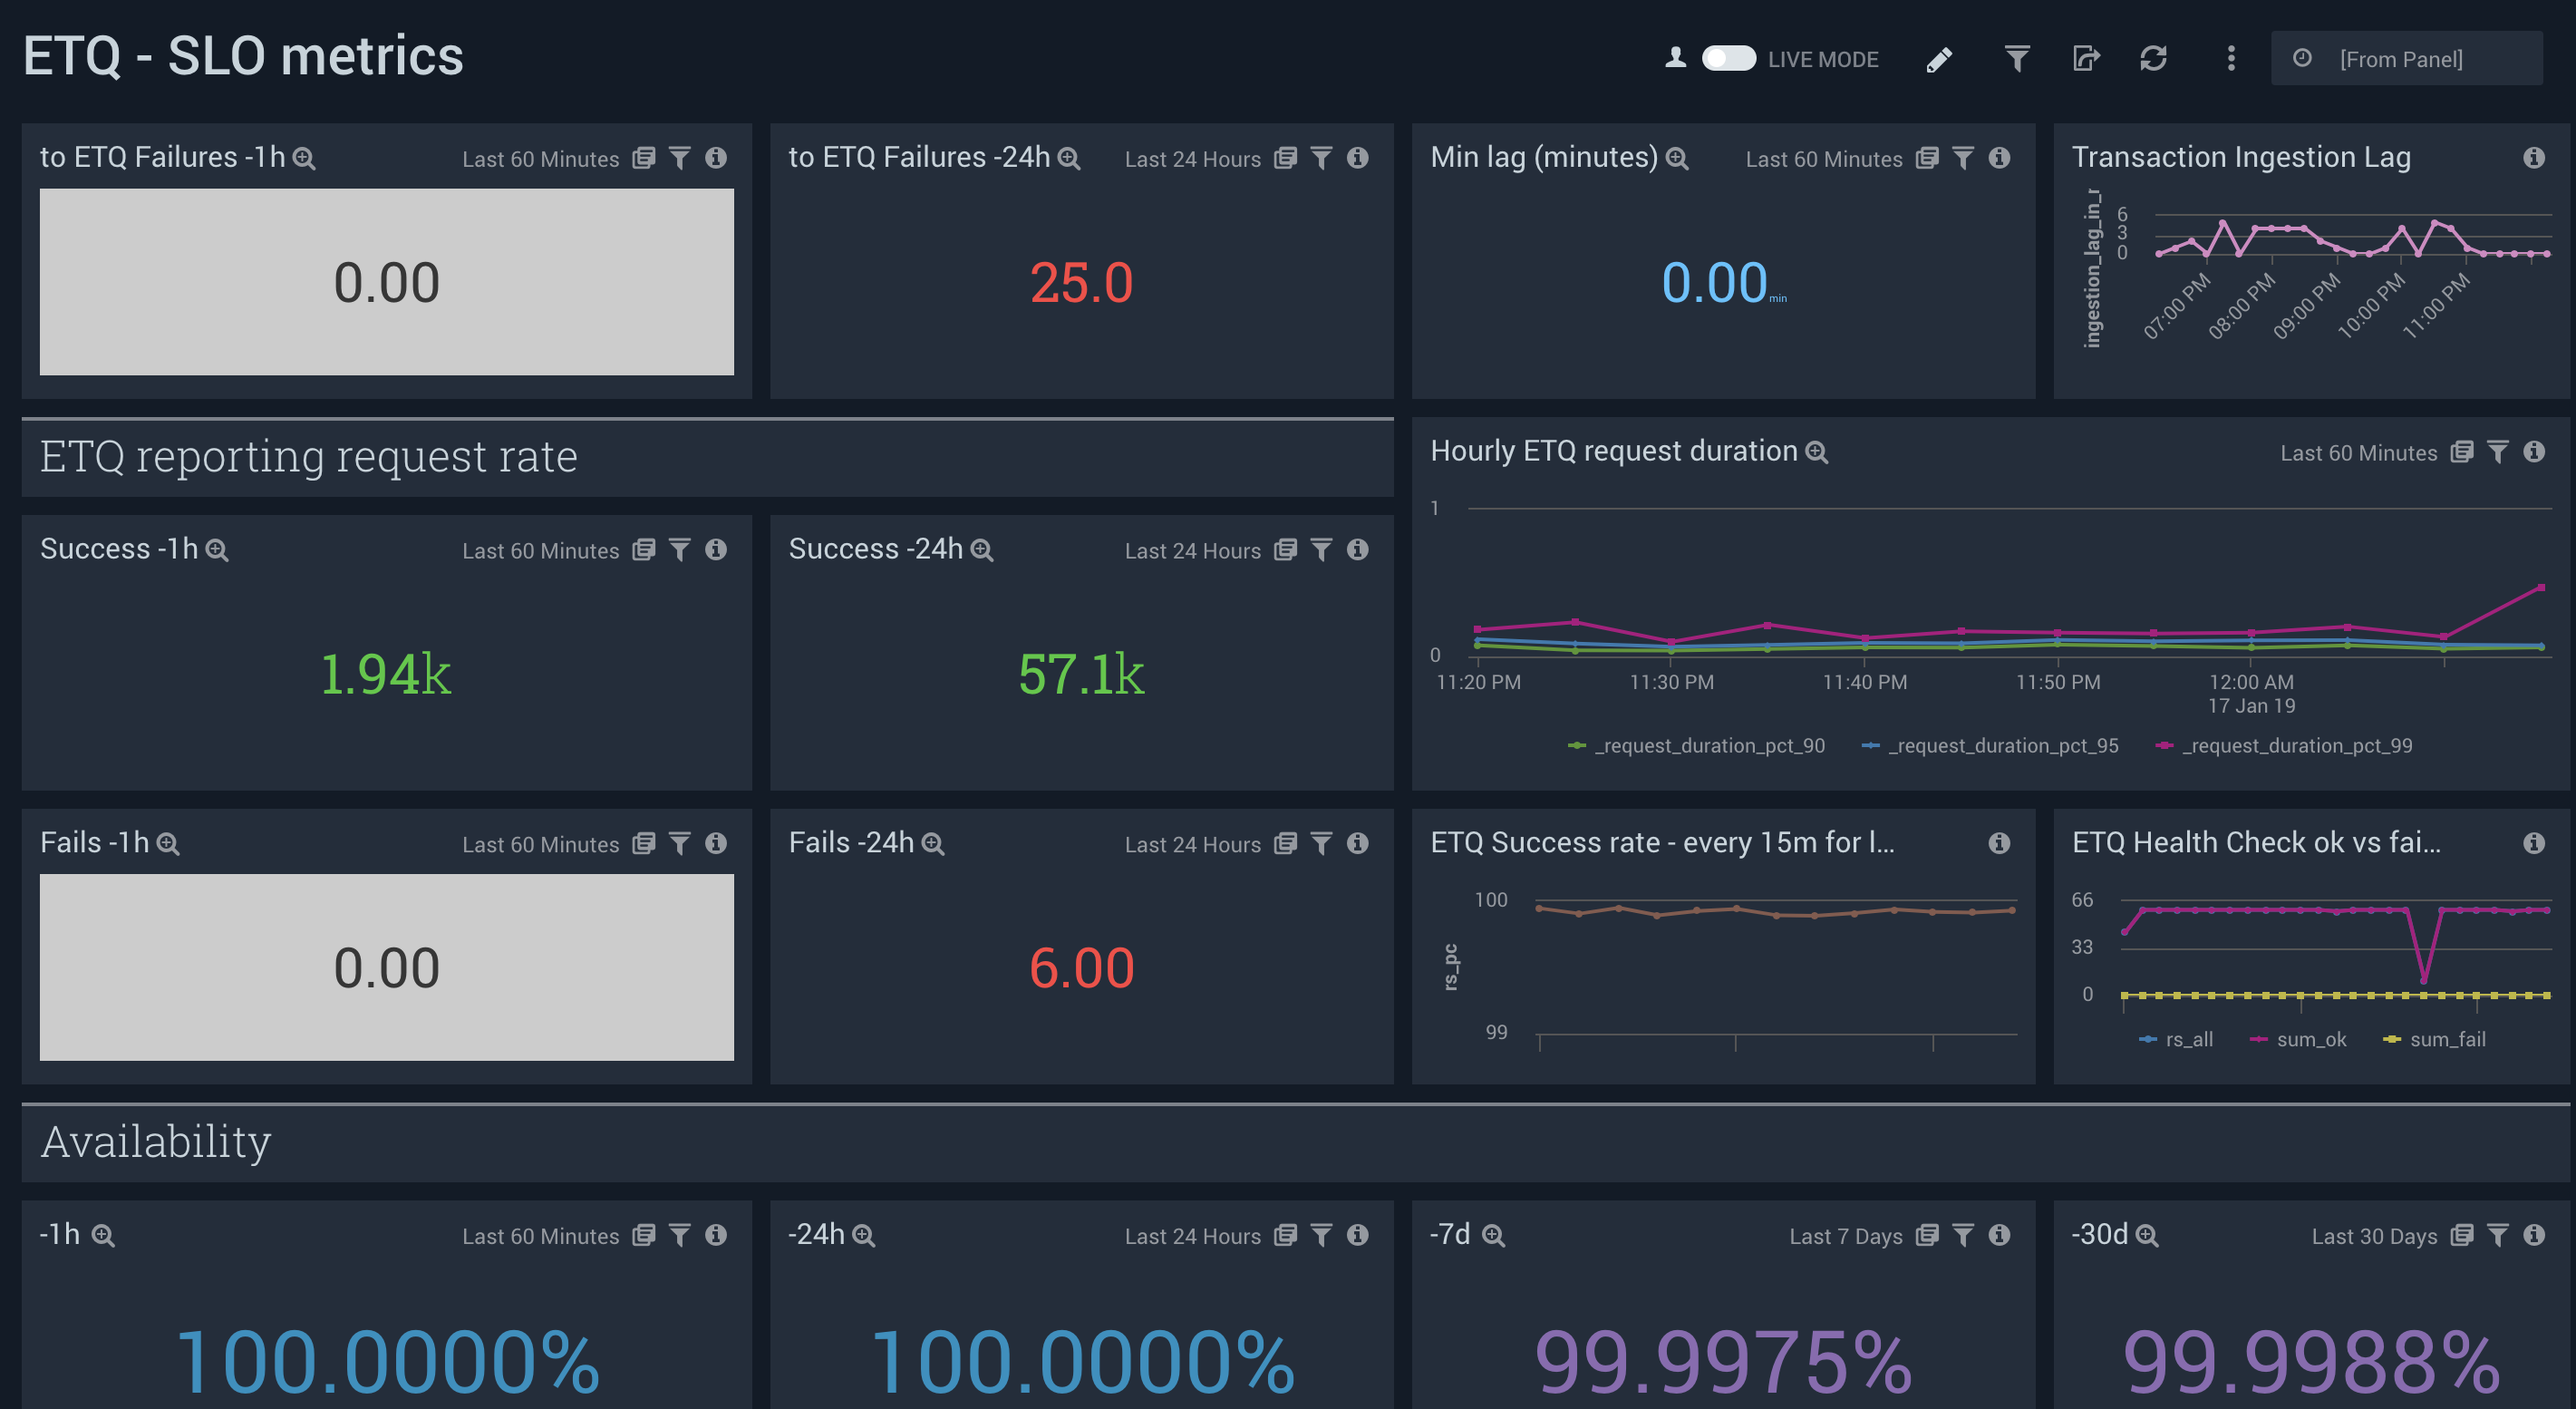
Dashboards
Alerting
Alerting
- Inform humans about a unexpected behaviour
- Not able to fulfil a SLO
- Some dependency is malfunctioning
Alerting Channels vs Severity
| Severity | Channel |
|---|---|
| Trivial | Log |
| Low | Ticket |
| Medium | |
| High | Pager |
Alerting Lesson
- Too much alerting is the same as no alerting
On-call responsibilities
- Monitor the SLOs
- Work on Resilience stories
- Veto power to Deploy and Releases
Post-mortem
Pre-work
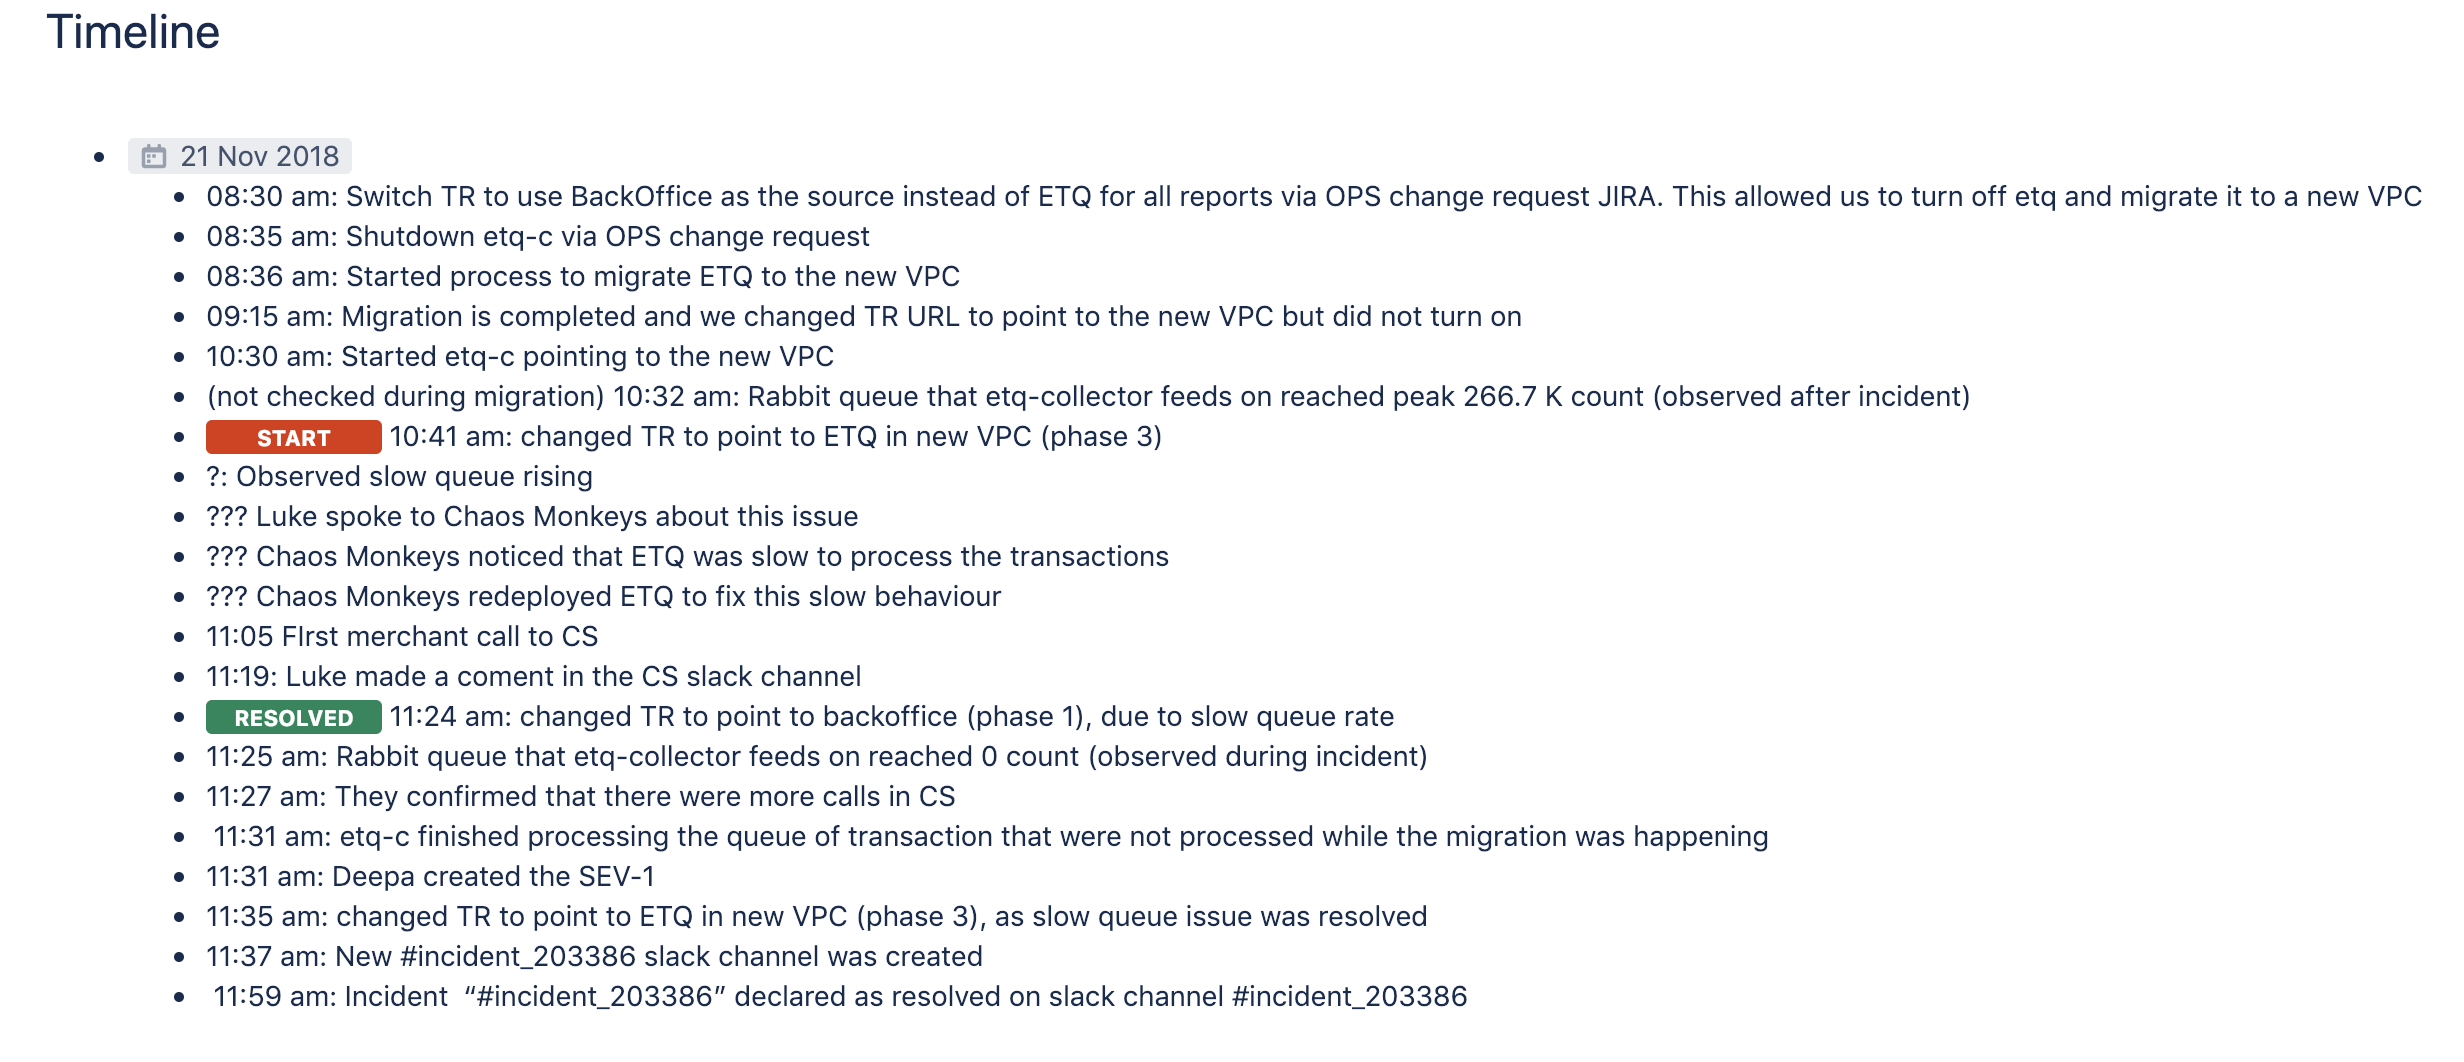
Capture an incident timeline
Hosting Post-mortem session
Apply the retrospective prime directive
Regardless of what we discover, we understand and truly believe that everyone did the best job they could, given what they knew at the time, their skills and abilities, the resources available, and the situation at hand.
Incident Retro
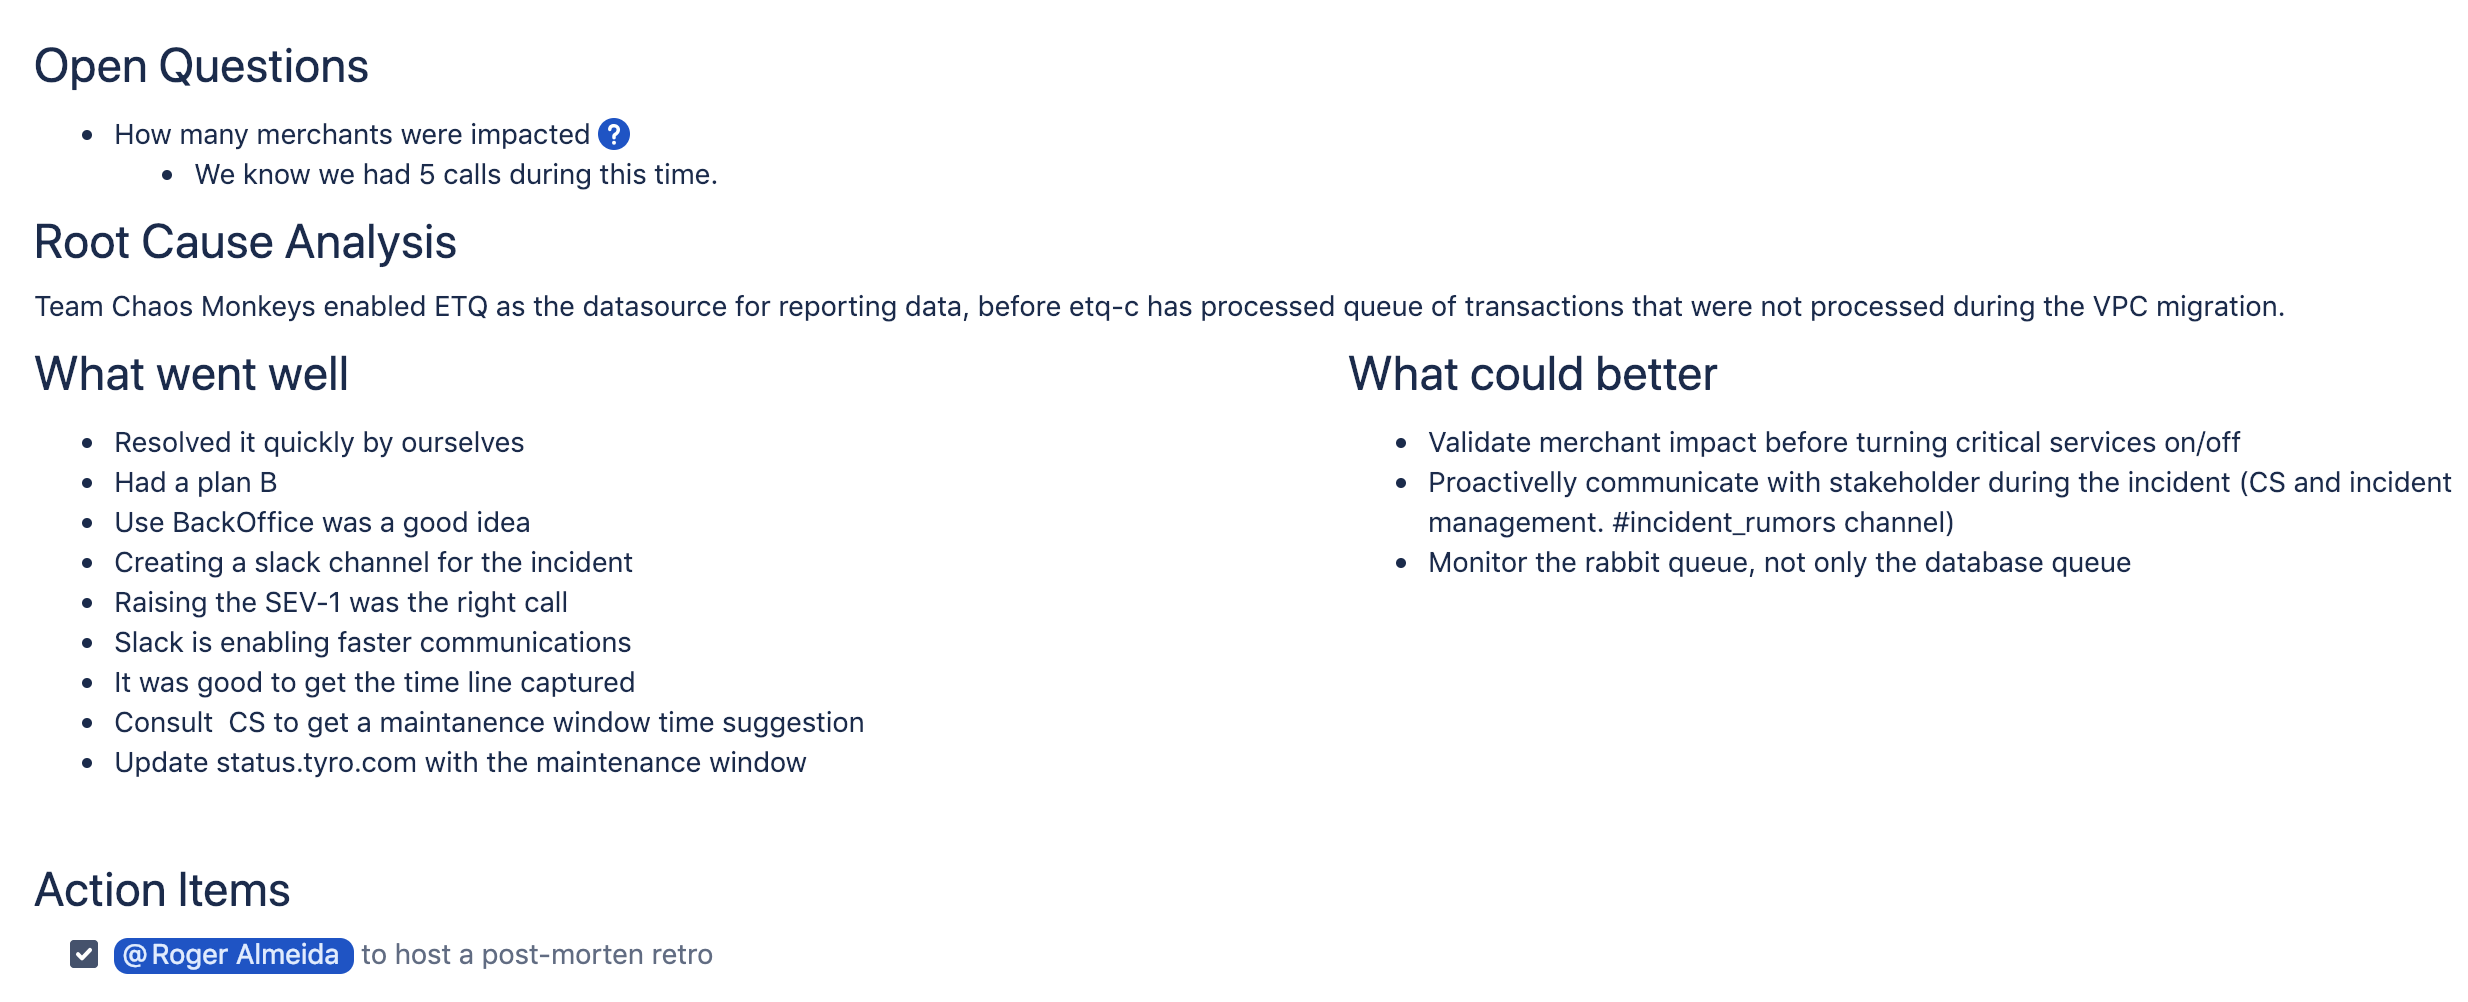
Post-mortem
- Impacts our backlog
- Improves our architecture
- Improves our application design
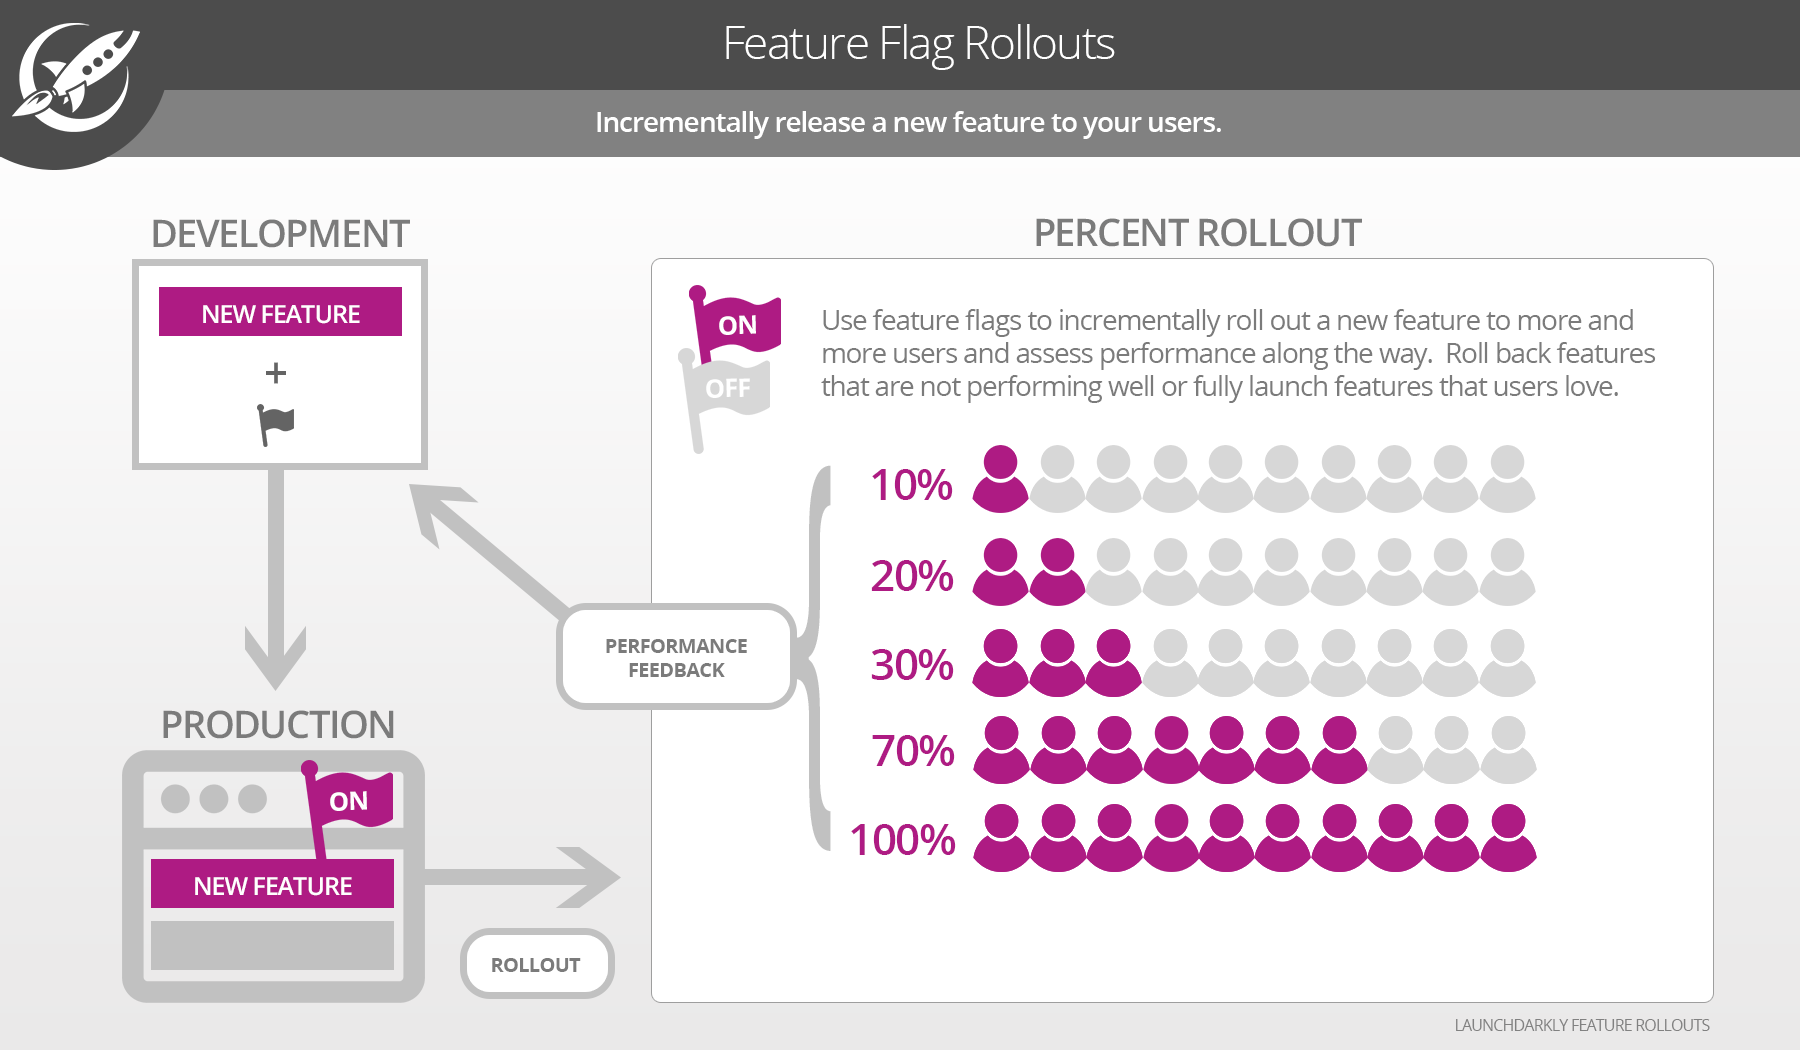
Release Strategy
Dark Launch
graph LR
Client ==> Current
style Current fill:#f3faff
Dark Launch
graph LR
Client ==> Current
New(New)
style New fill:#6FF4BA
style Current fill:#f3faff
Dark Launch
graph LR
Client ==> Current
Client -.-> New(New)
Current -. Compare .- New
style New fill:#6FF4BA
style Current fill:#f3faff
Dark Launch
graph LR
Client ==> New(New)
style New fill:#6FF4BA
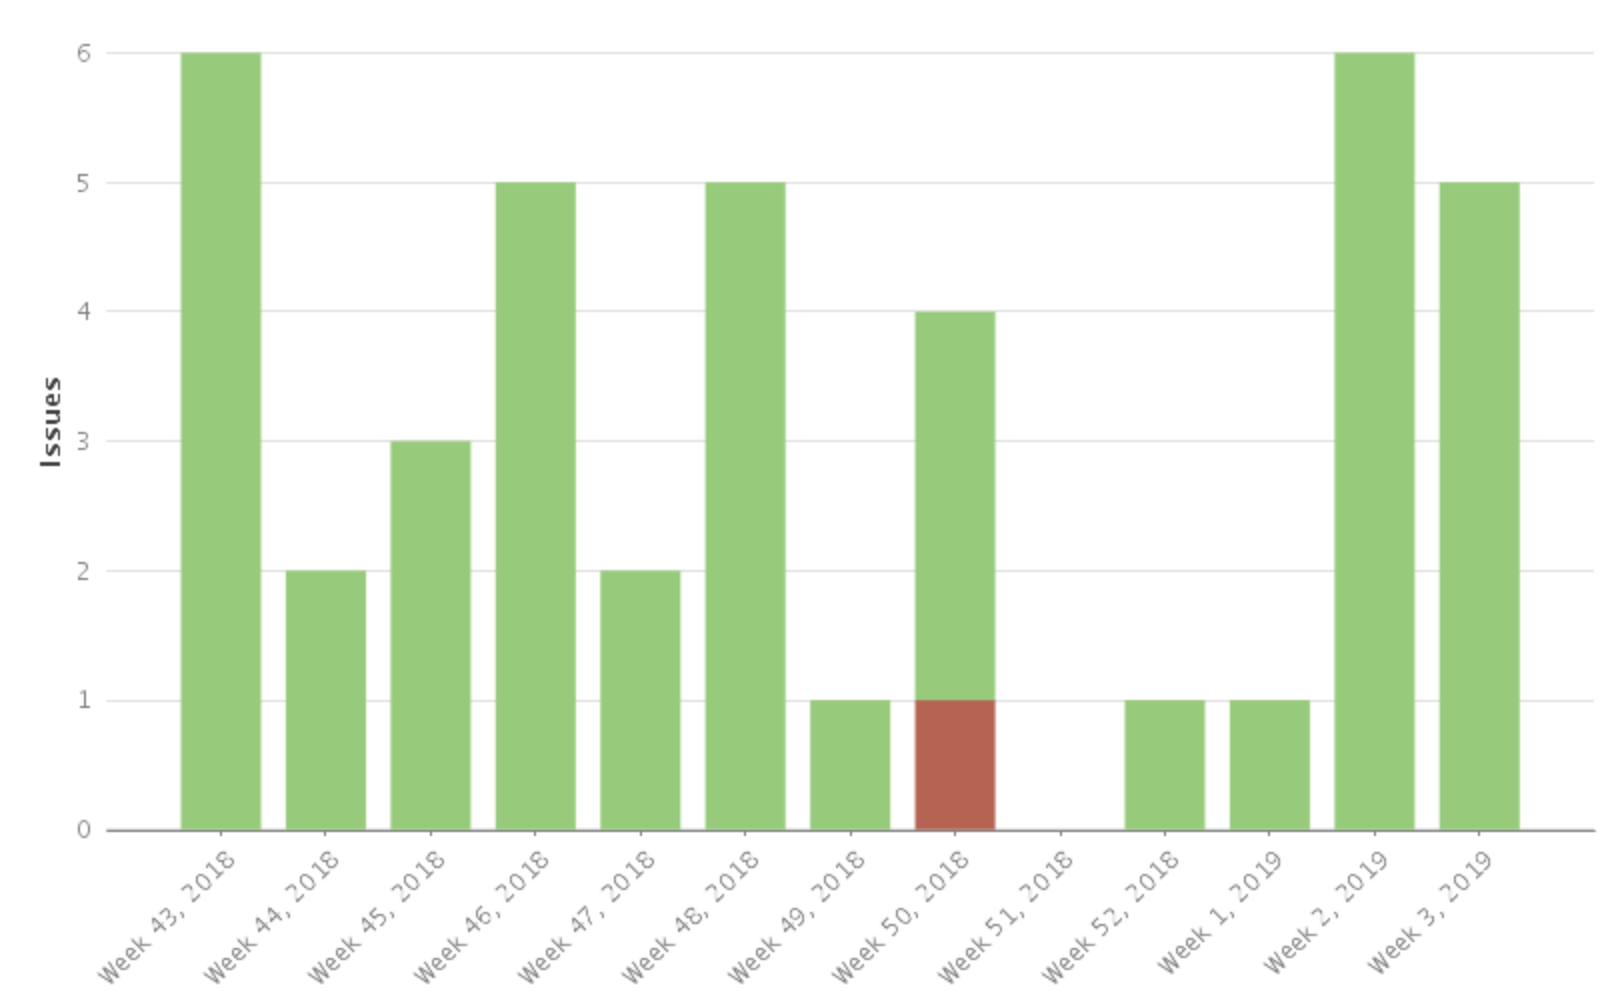
Our current status
Deployes per week
Release Time (from commit to deploy)
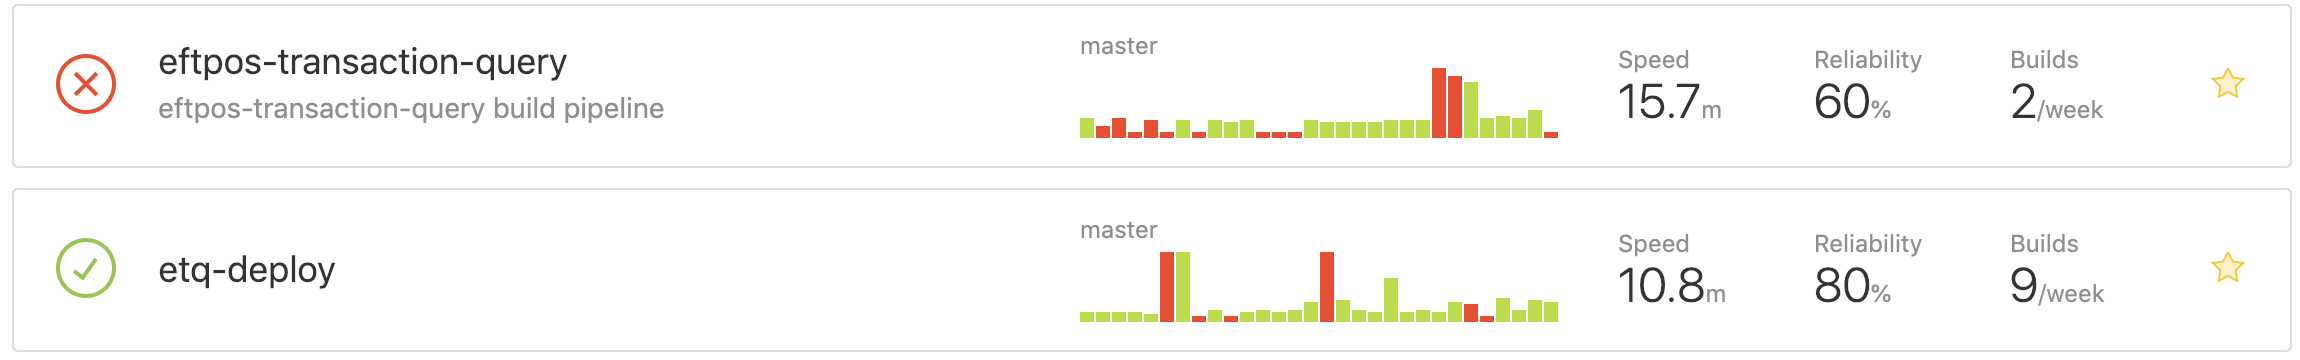
Availability
Worst 30 days between November/2018 and December/2018:99.6%
Conclusion
- We are happy, there is no turning back
- Easier than never to introduce changes in production
- Enhancing reporting experience to our clients
- Spreading the lessons to other teams